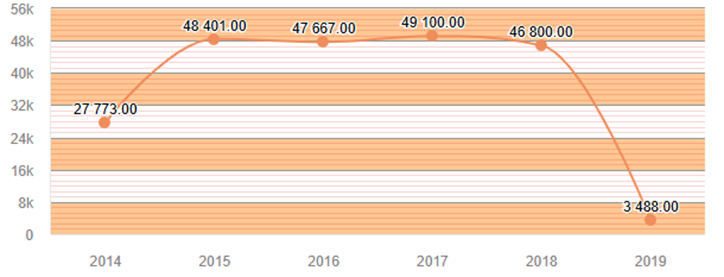
New Component: Chart Tile
Add a modern tile with an embedded chart to your dashboards
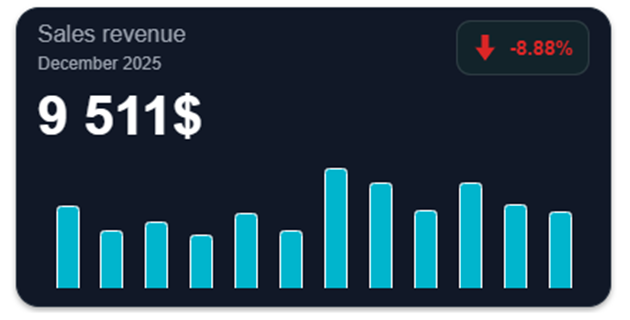
After the Trend Tile and the Progress Tile, the tile family is growing with a brand new component: the Chart Tile.
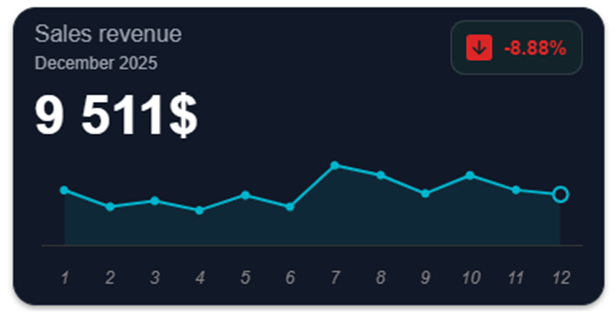
Add a chart inside a modern-designed tile to take your dashboards even further.
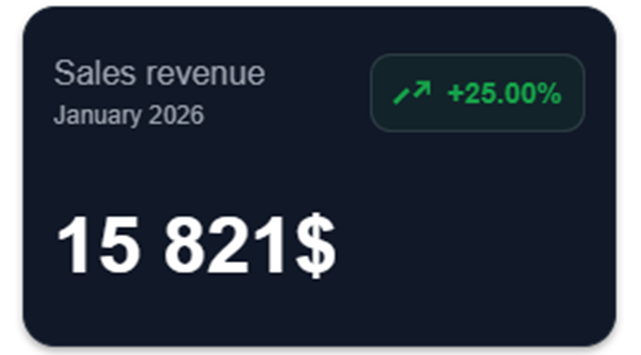
The tile can also be used without a chart.
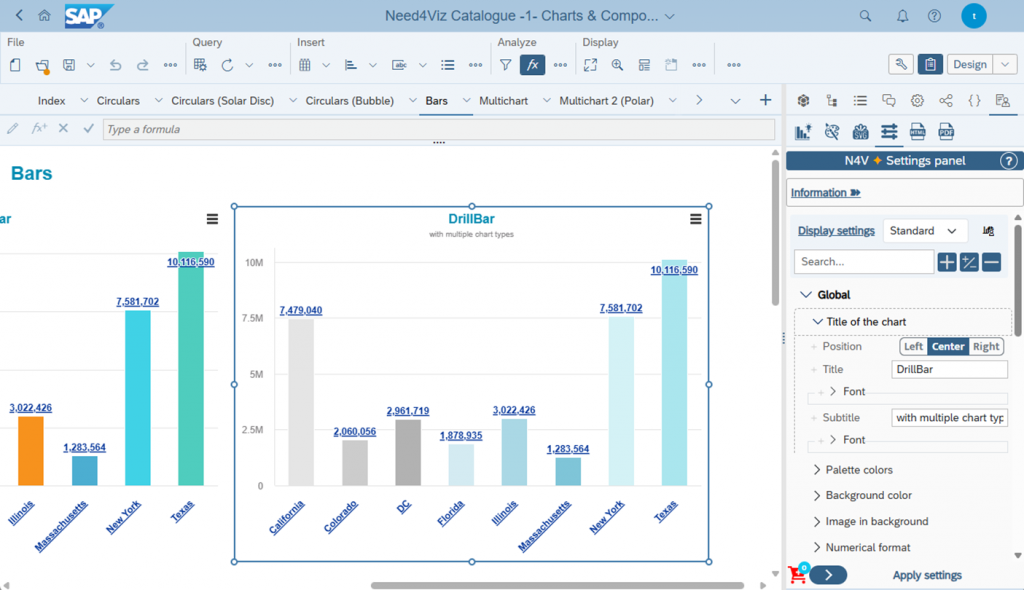
N4V Panel: Settings Panel
Configure N4V components even faster and more easily
The Settings Panel is now available in the N4V Panel. This panel allows you to choose between three display modes:
- Basic: Only the most frequently used settings are displayed
- Standard: Go further in customizing your components
- Advanced: Display all available settings (“Advanced settings”)
Smart display, a search bar, and more complete this panel, which also allows you to apply settings to multiple components at once, in a single click.
Widget Enhancements
New upgrades for more power
New features are now available in several widgets, including:
- Data stacking is now available in Multi Drill and Timeline.
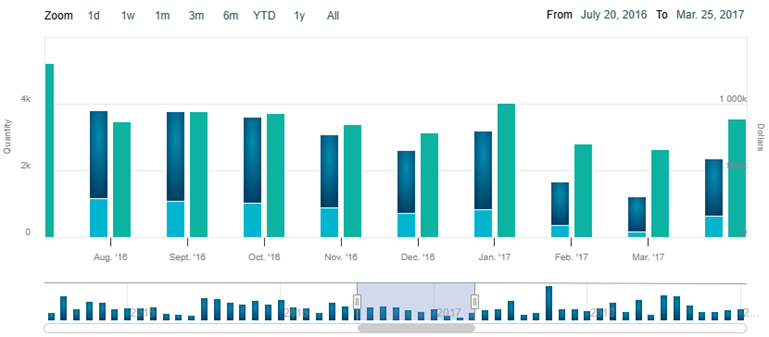
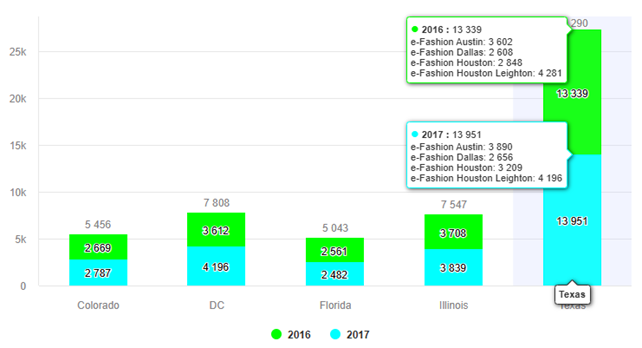
- Axes in Multi Chart and Multi Drill can be further customized (logarithmic scale, inversion, mirroring, alternating colors, gridlines, etc.).
- Dimension value colors can now be provided as inputs in Multi Drill and Pie in Pie.
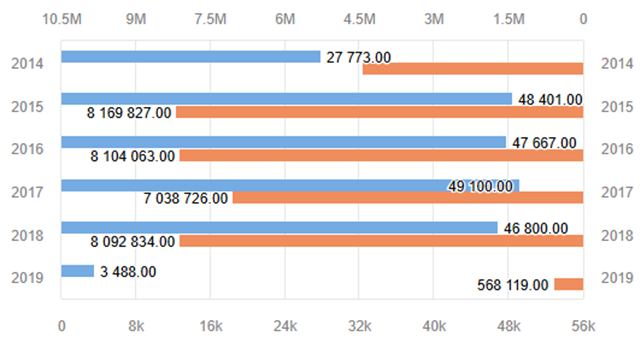
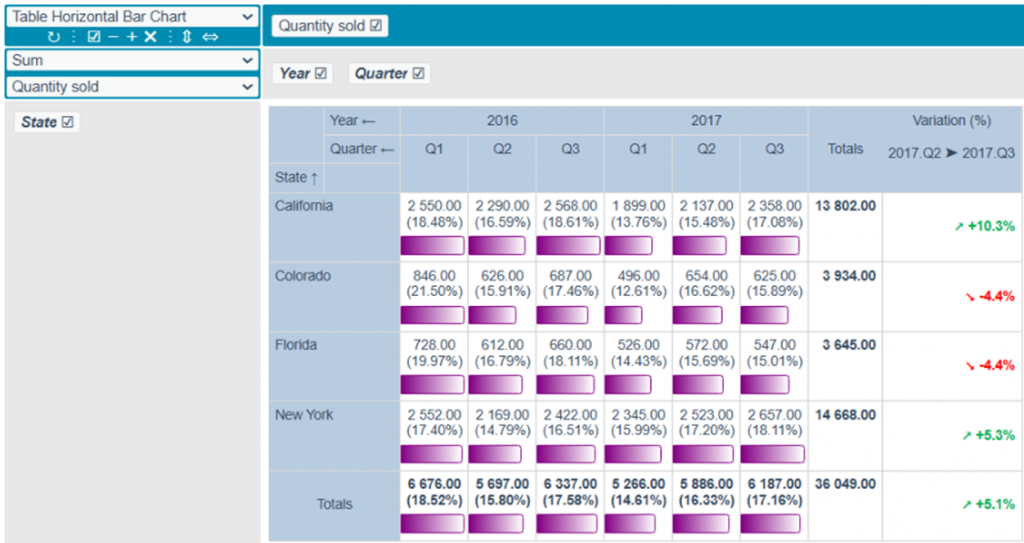
Pivot Table
Even more display options
The Pivot Table now allows you to display tables with horizontal bar values.
Bar tables (vertical/horizontal) can be even further customized (enhanced calculations, visual rendering, tooltips, etc.).
A variance calculation column can now be added.
Many new options and improvements have been added to existing renderings.
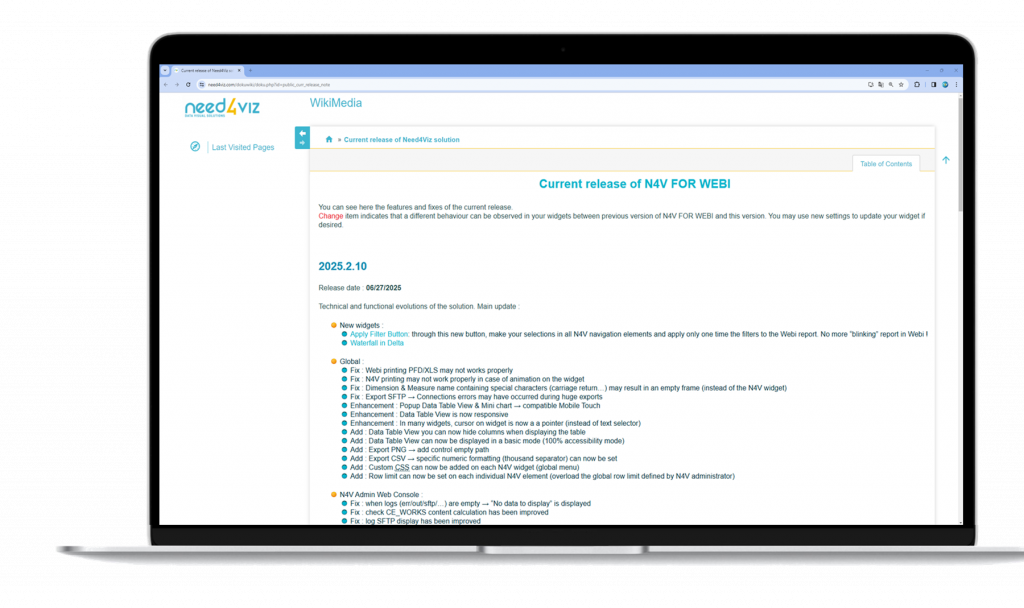
See the Wiki for the full report
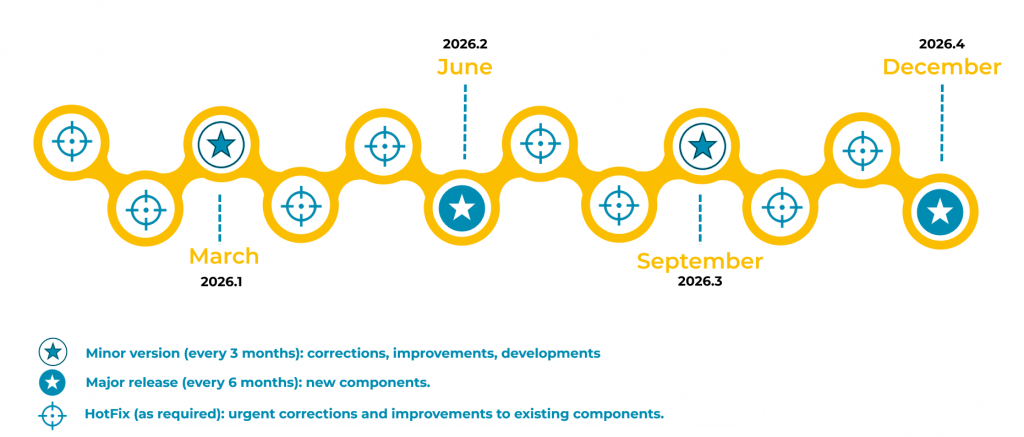
Two Major Releases in 2026